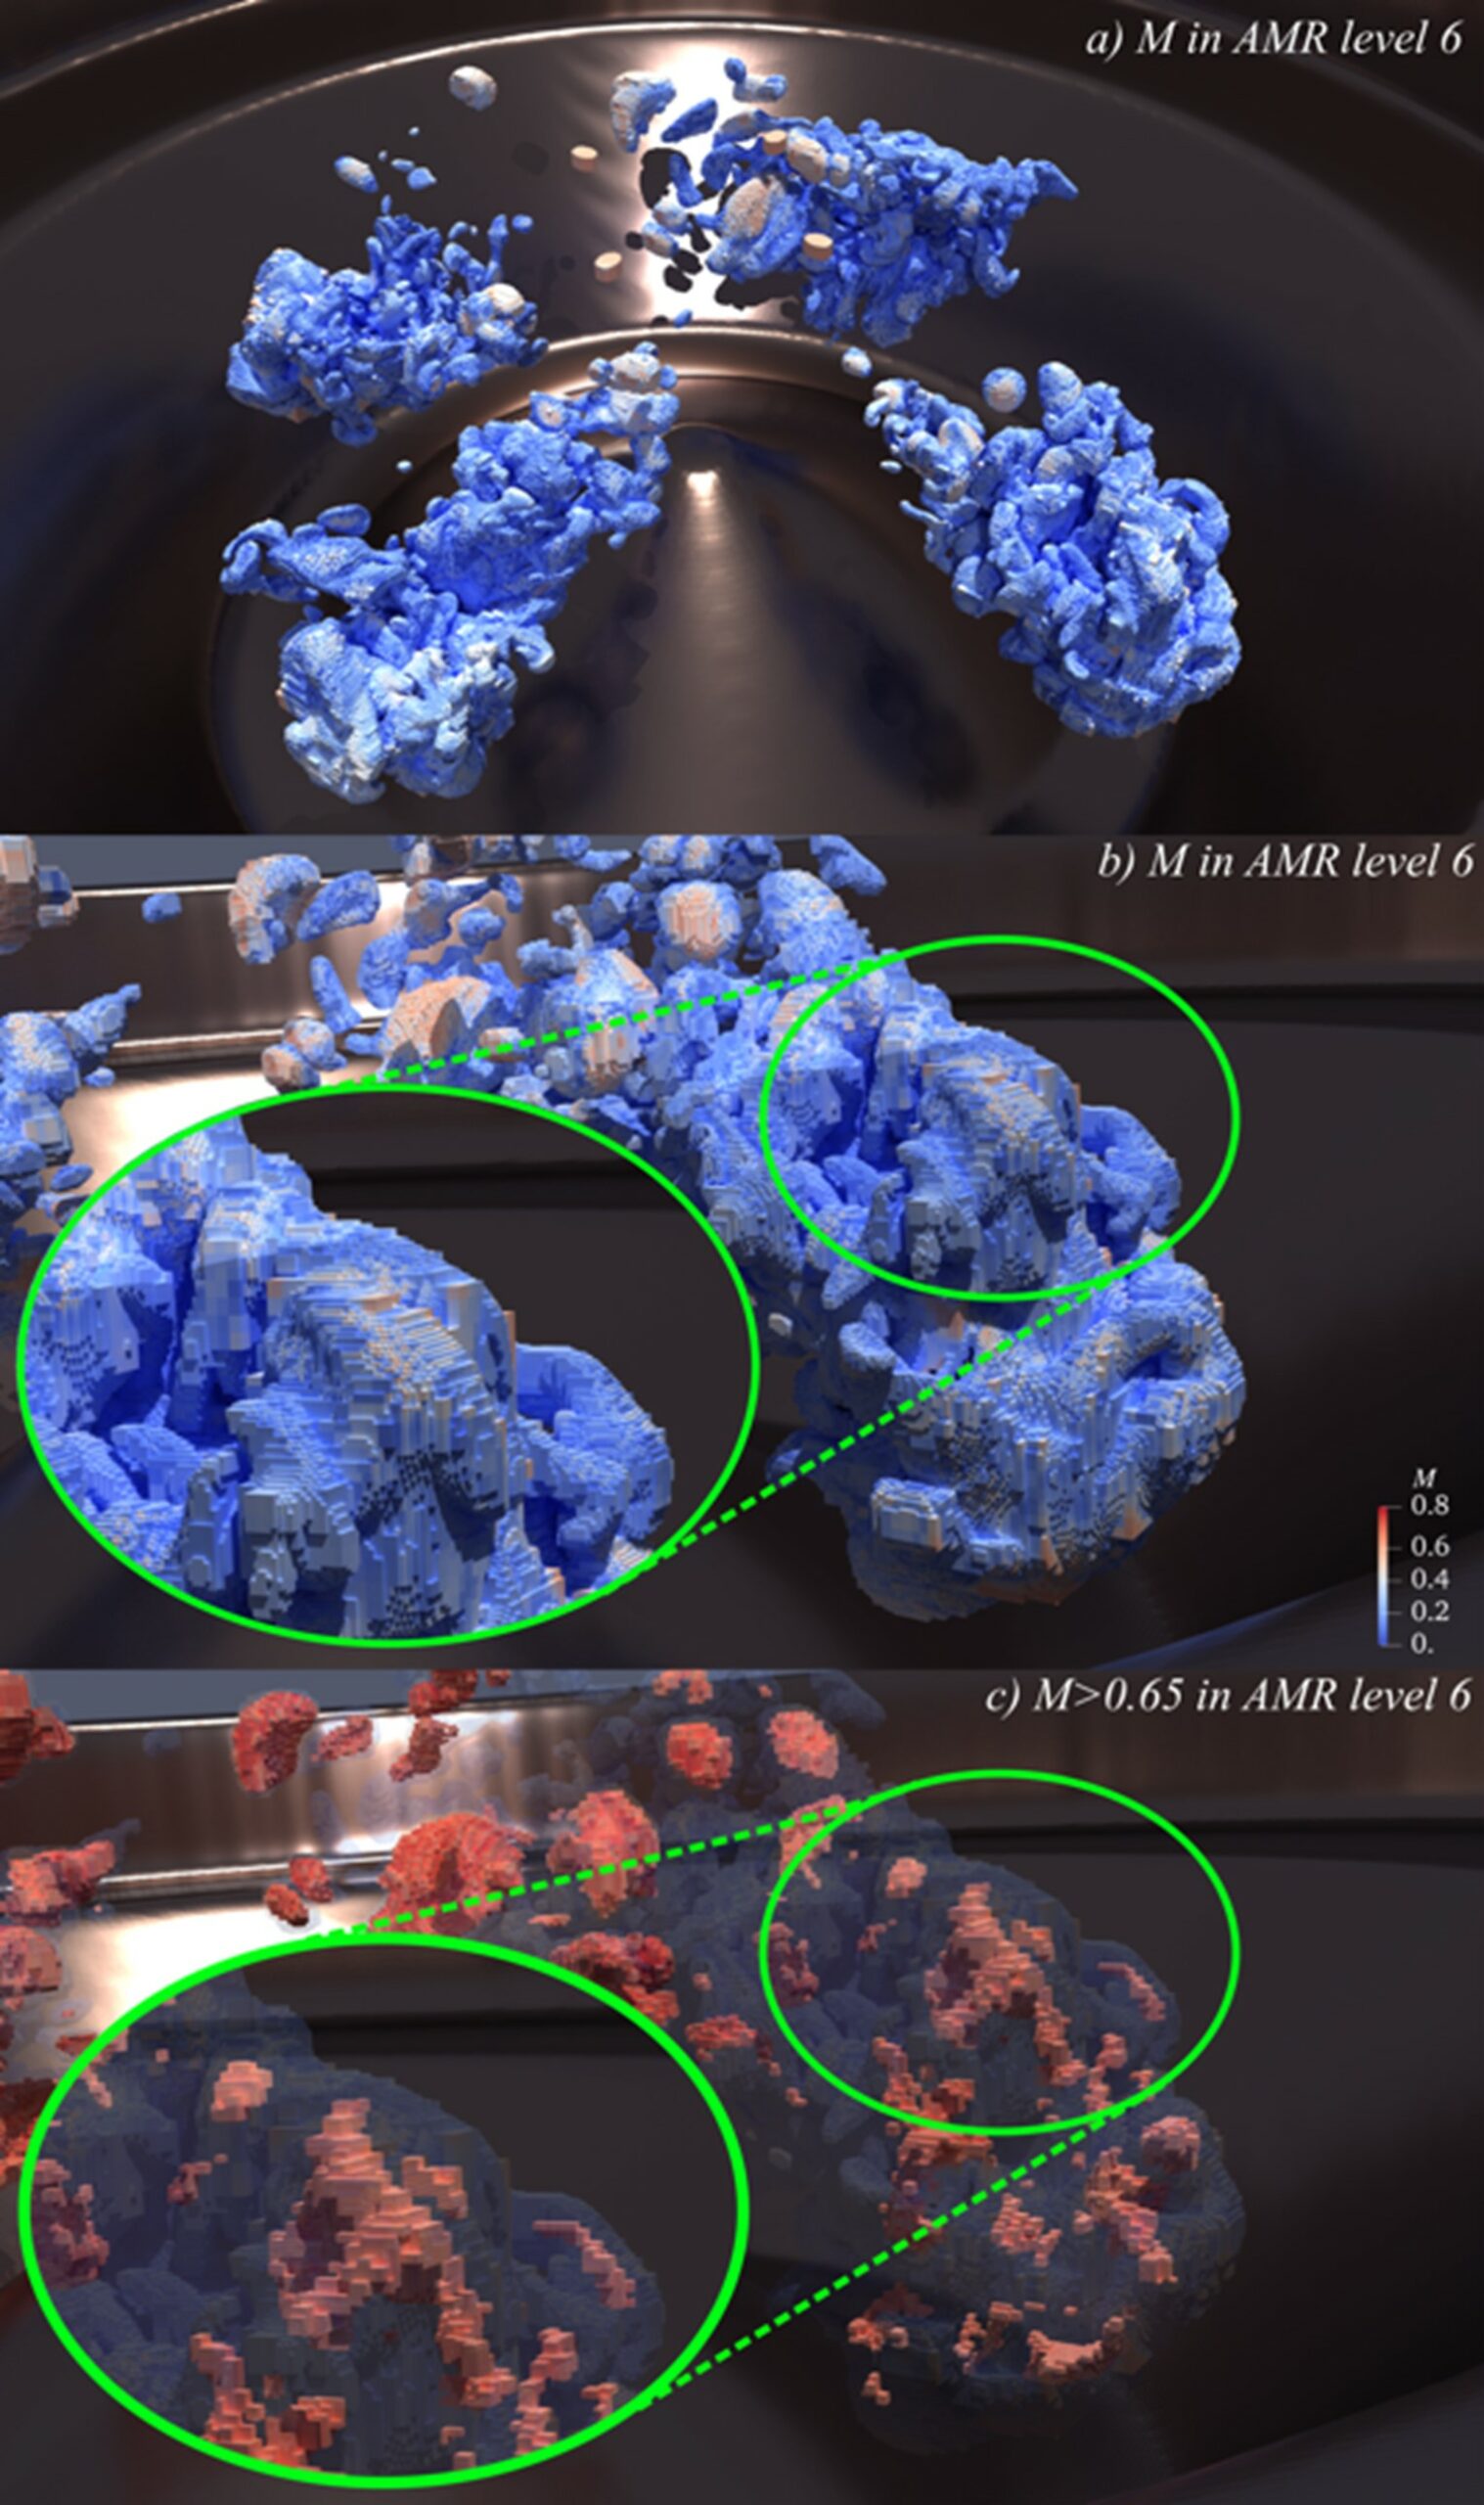
Figure 3. To each box, containing at least 163 cells, corresponds a single nondimensionalized metric value M, colored from blue to red; higher values of M correspond to a larger possibility for autoignition. (a) Metric values for the box subset on the highest level of refinement (level 6). (b) Detailed view of adaptive mesh refinement (AMR) blocks in the highest level of refinement. Zoomed-in view (green circle) shows the blocks in more detail. (c) Same detailed view as in panel a but only for blocks with anomaly metric M > 0.65. Figures were produced a posteriori using Python and ParaView. (Credit: J. Salinas, M. Arienti, and H. Kolla [Sandia National Laboratories]))