The dawn of exascale computing will bring exciting new capabilities to bear on scientific investigation as well as unprecedented challenges that we should reframe as opportunities in order to find “exemplary solutions”. Numerous phenomena realized over the past several decades pose challenges waiting to be met head-on with novel ideas and technologies: the doubling effect of Moore’s law and the concomitant increase in data generation; the explosion of high-resolution sensors and instruments; the modern, expanded scientific process; the lagging ability to store data; and the rise of machine learning. A review offered by the Exascale Computing Project’s Data and Visualization lead was published in the July/August issue of IEEE Computer Graphics and Applications.
Hardware and software developments have translated into superior data quality, faster data processing, and more powerful simulations, all of which have driven the computational and data exploration scientific paradigms that have arisen in response to our new capabilities. The scientific process in modern times has expanded to include data verification (i.e., checking whether simulations do what they are designed to do) and data validation (i.e., checking whether simulations match real-world experimental results). Challenges inherent in the traditional scientific process include creating visual representations of higher-dimensional data elements such as tensors and functions; supporting complex data structures and complex unstructured mesh types; and developing effective ensemble (i.e., input/output results) representations and methods. Verification and validation challenges include use of high-dimensional visualization techniques to visualize diverse experimental and simulation ensemble data and to compare ensembles with their members. The biggest challenge in the exascale era will be ensuring scientific visualization methods account for the full scientific process: tools must be able to operate on spatial/temporal representations at the bottom of the hierarchy as well as the abstract ensemble level at the top, and all levels in between.
Data storage deficits co-existing with today’s voluminous data have resulted in much longer timeframes for storing data compared with producing it. This challenge has led to the development of edge computing to act on data where it’s gathered and to approaches including compression, sampling, and multiresolution representations that aim to reduce the size of a dataset without reducing its usefulness. A promising new method, called in situ visualization, visualizes data as the simulation is running. Challenges associated with the method involve improving automation by selecting effective parameters and supporting visual exploration following simulations. Ray-tracing accelerators, which can be customized to handle large-scale visualizations and renderings, may enable scientists to trade memory-heavy geometries for directly sampling scientific data. Additionally, the rise of machine learning techniques creates a challenge similar to visualizing ensembles—that of using visualizations to explain the results of machine learning applications—because machine learning data typically are ensembles. More effective ensemble visualization methods are needed.
James Ahrens. “Technology Trends and Challenges for Large-Scale Scientific Visualization.” 2022. IEEE Computer Graphics and Applications. Visualization Viewpoint. July/August.
https://doi.org/10.1109/MCG.2022.3176325
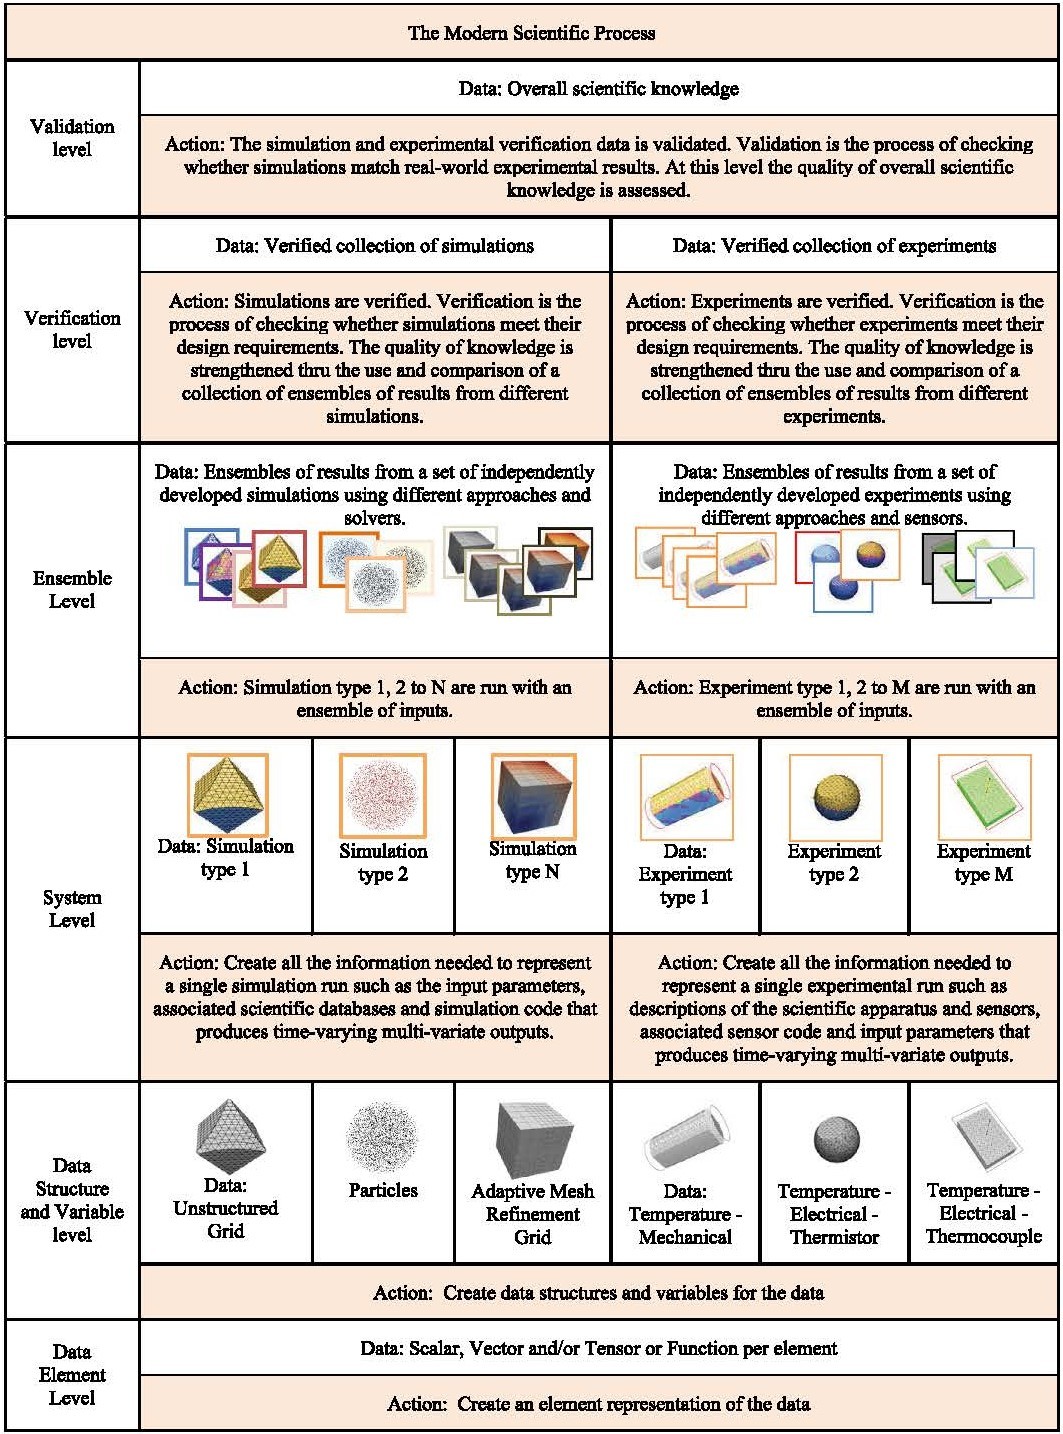
A representation of the levels in the modern scientific process. At the data structure and variable level, the images visually represent the heterogeneity of grid types for simulations and differing types of sensors for experiments. At the system level, the images represent different simulation and experiment types that are ready to run. At the ensemble level, the images represent a collection of ensembles of results from the simulations and experiments.