By Rob Farber, contributing writer
Visualization and analysis on any high-performance computing system faces a last-mile problem in which the potential of the resource can only be realized when people have the tools to examine and interpret the data created on them. The data and visualization portfolio in the US Department of Energy’s Exascale Computing Project (ECP) recognizes that storage alone cannot fix the last-mile problem because scientists can now compute their models faster than the hardware can store the resulting data. This compute vs. storage dichotomy will diverge even further on the new exascale systems because concurrency will increase by roughly 5–6 orders of magnitude, yet system memory and I/O bandwidth will only grow by 1–2 orders of magnitude.[i] To address this challenge, scientists can leverage a variety of new software tools that support an ecosystem of data-centric programming models, compression, and innovative big-data approaches such as in-situ visualization. In-situ analysis and visualization is an important new capability for big-data simulations that enables access to simulation data on the supercomputer while the simulation is still running.
Such a visualization and analysis ecosystem must be expressive enough to specify what data will be kept, flexible enough to enable future analysis, and convenient enough that scientists can and will use it.[ii] The output data format must be relatively general because the scientist must, out of necessity, specify what images and data will be kept prior to submitting the run on the supercomputer. This precludes simply storing in-situ rendered images because the scientist may need to, for example, visualize the data from unanticipated points of view, examine occluded features, or change the color map to highlight interesting phenomena. Along with powerful analytic capabilities, the software ecosystem must also provide general mechanisms to identify, track, and trigger I/O operations only when events of interest occur.
Cinema is part of a software ecosystem that meets these ECP mission requirements. David Honegger Rogers (Figure 1), PI and team lead for the Data Science at Scale team at Los Alamos National Laboratory (LANL), notes the strong collaboration with the ECP ALPINE project that provides the in-situ infrastructure leveraged by Cinema, “Fundamentally, the Cinema project provides images that people understand combined with the ALPINE project infrastructure and analytic capabilities they need. Our tools focus on providing scalable analytics and visualization software that effectively supports scientific discovery and the understanding of massive data.”
Fundamentally, the Cinema project provides the images that people understand combined with the ALPINE project infrastructure and analytic capabilities they need. Our tools focus on providing scalable analytics and visualization software that effectively supports scientific discovery and the understanding of massive data. – David Honegger Rogers
The December 3, 2020, episode of ECP’s Let’s Talk Exascale podcast, “Supporting Scientific Discovery and Data Analysis in the Exascale Era,” featured the Data and Visualization portfolio lead Jim Ahrens discussing ECP visualization tools, including Cinema and ALPINE, with host Scott Gibson.

Figure 1. David Rogers
From Exascale to Laptops—Cinema for Scientific Visualization
Cinema is a lightweight visualization ecosystem with a database foundation that stores imagery and associated metadata. Developed at LANL, the Cinema project has received ECP funding to develop scientific workflows and incorporate them into components of the ECP ALPINE project, including ParaView, Catalyst, VisIt, and the lightweight Ascent in-situ visualization and analysis infrastructure. With these capabilities, scientists can perform in-situ visualizations at scale on exascale systems and visualize their images in post-hoc workflows by using a web browser or Jupyter notebooks.
During configuration of the in-situ rendering and prior to job submission on the supercomputer, scientists can specify the camera angles for the in-situ rendering. They can then view, search, or analyze the resulting images by using Cinema tools or their own scripts. This analysis can be done on a scientist’s laptop or on a supercomputer depending on the size of the image database. Rogers notes, “Fundamentally, we provide images of data that people understand. Users can create a workflow from a Python script to run whatever you want to image. Internally, Cinema focuses on the images and metadata (e.g., time, angle), which the supercomputer has written out to a database. Using an image database saves writing all simulation output, which can be huge on exascale systems. People then analyze these databases from a single run or in combination with databases from multiple runs to view and explore their data in new ways.”
Fundamentally, we provide the images that people understand. Users can create a workflow from a Python script to run whatever you want to image. Internally, Cinema focuses on the images and metadata (e.g., time, angle), which the supercomputer has written out to a database. Using an image database saves writing all simulation output, which can be huge on exascale systems. People then analyze these databases from a single run or in combination with databases from multiple runs to view and explore their data in new ways. – David Honegger Rogers
Cinema’s interactive features, including combining visual elements from multiple sources (e.g., image compositing), are quite powerful. Rogers notes, “We are very excited for the near future. The powerful thing about working in an image space is that a scientists can composite information with layers, turn layers on and off, change lighting, and perform other complex activities to highlight information. Metadata stored by Cinema, rather than pixels, gives scientists the ability to change the color of targeted aspects of the image. People can see the dynamics as well.”
Compositing is a fast, interactive experience with Cinema. The original paper, “Cinema Image-based In Situ Analysis and Visualization of MPAS-Ocean Simulations” claims, “The compositing pipelines provide an experience that mirrors the interactive exploration of raw simulation data but with a constant computation time for all analysis and visualization algorithms.” The bounded runtime combined with data reduction techniques make it possible to perform very detailed analysis on laptop computers. The authors note, “While data reduction is highly dependent on sampling and the specified visualization pipelines, this simulation claimed an approximately 202–16 GB reduction but an increase from 101 MB for a one-image-per-time-step traditional in-situ workflow.” The increase in a single image is owing to the general data format rather than just storing image pixels. This allows for coloring according to different parameters and other features, thereby enabling scientists to create very informative images (Figure 2).
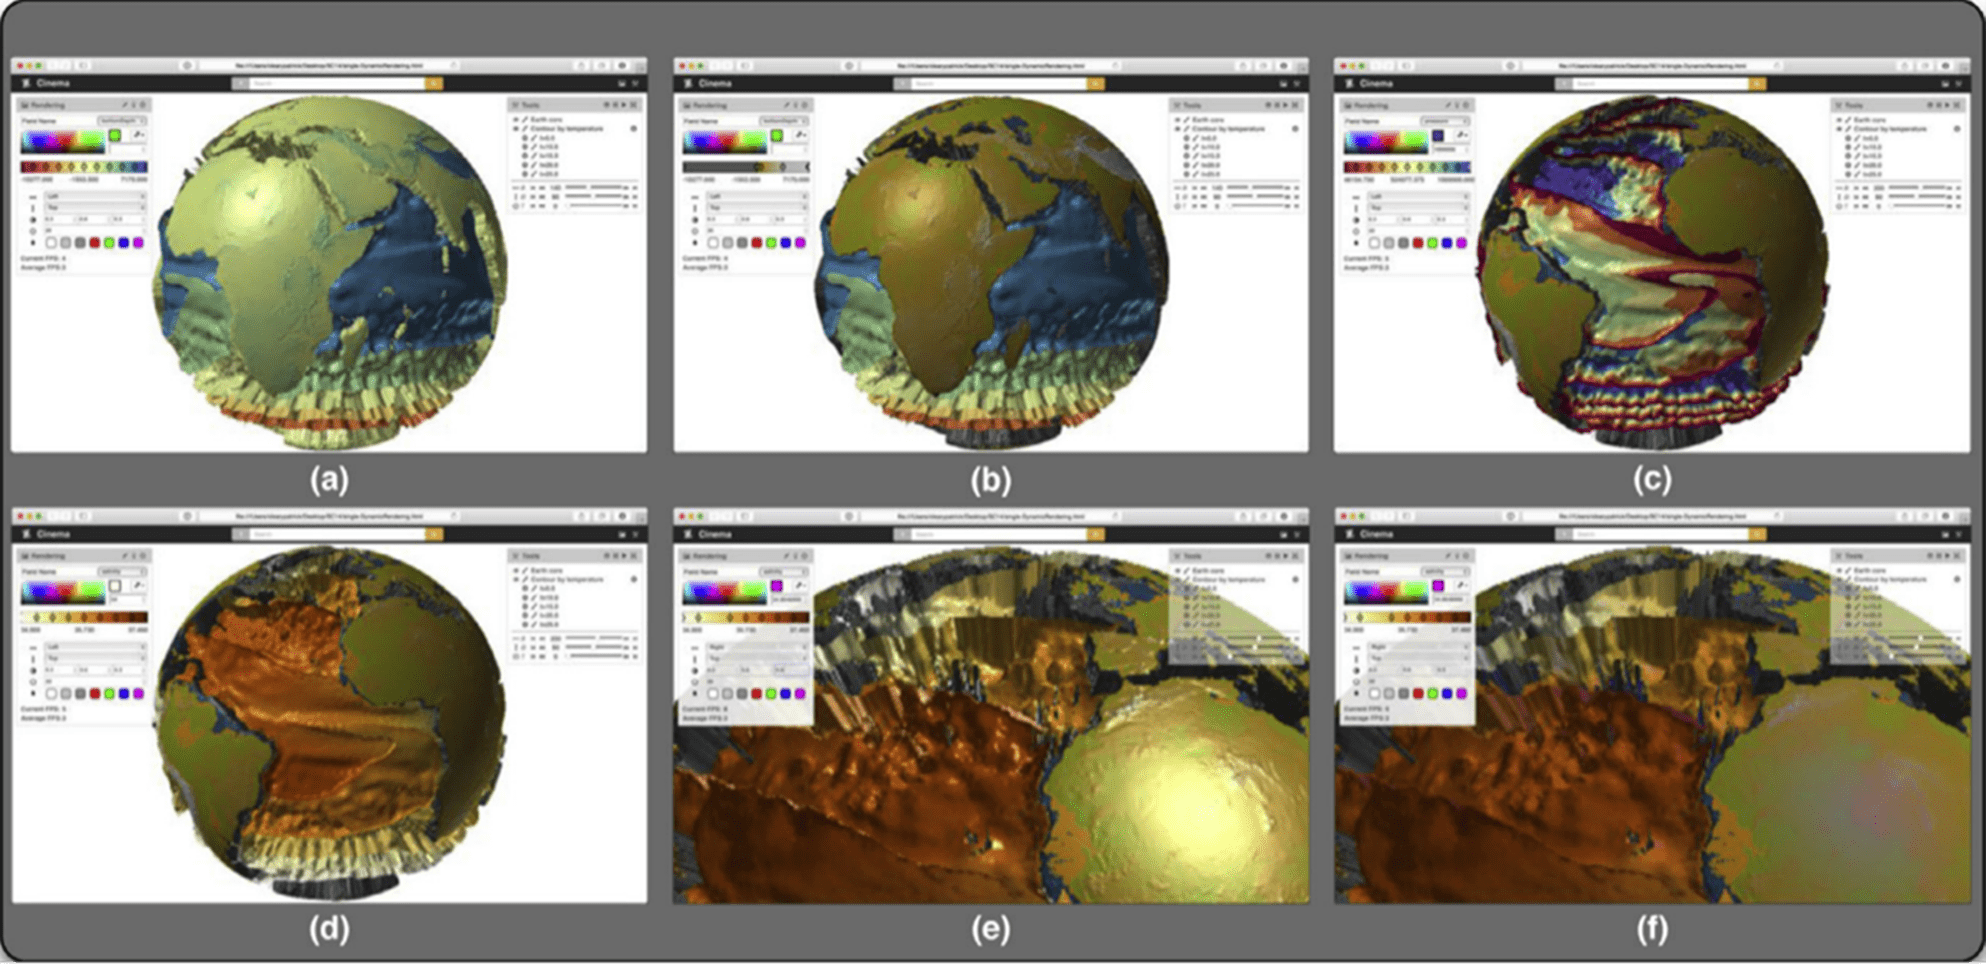
Figure 2. Various color and rendering capabilities. (a) and (b): Temperature isosurfaces with an Earth core colored by a spectral or Earth-like colormap. (c) and (d): Dynamic coloring by different parameters (pressure and salinity) and colormaps. (e) and (f): Increasing the spectral contribution and changing color (blue) of the light.
The creation of image databases introduces trade-offs between the sampling rate and storage space. Excessive sampling over many parameters (e.g., isovalues, thresholds, timesteps, camera angles) can result in excessive storage utilization.
Image interpolation is one way to overcome excessive sampling. New images can be estimated by interpolating stored frames. Figure 3 shows a side-by-side comparison of the original (labeled original) and interpolated (labeled dain) image to highlight the efficacy of the image interpolation. These images, which are from “Interpolation of Scientific Image Databases,” show changing textures of atmospheric and oceanic currents in one frame of the Model for Prediction Across Scales (MPAS) dataset. The bottom-right image shows differences between the two. For more information about the methods and errors in this method, see “Interpolation of Scientific Image Databases.”
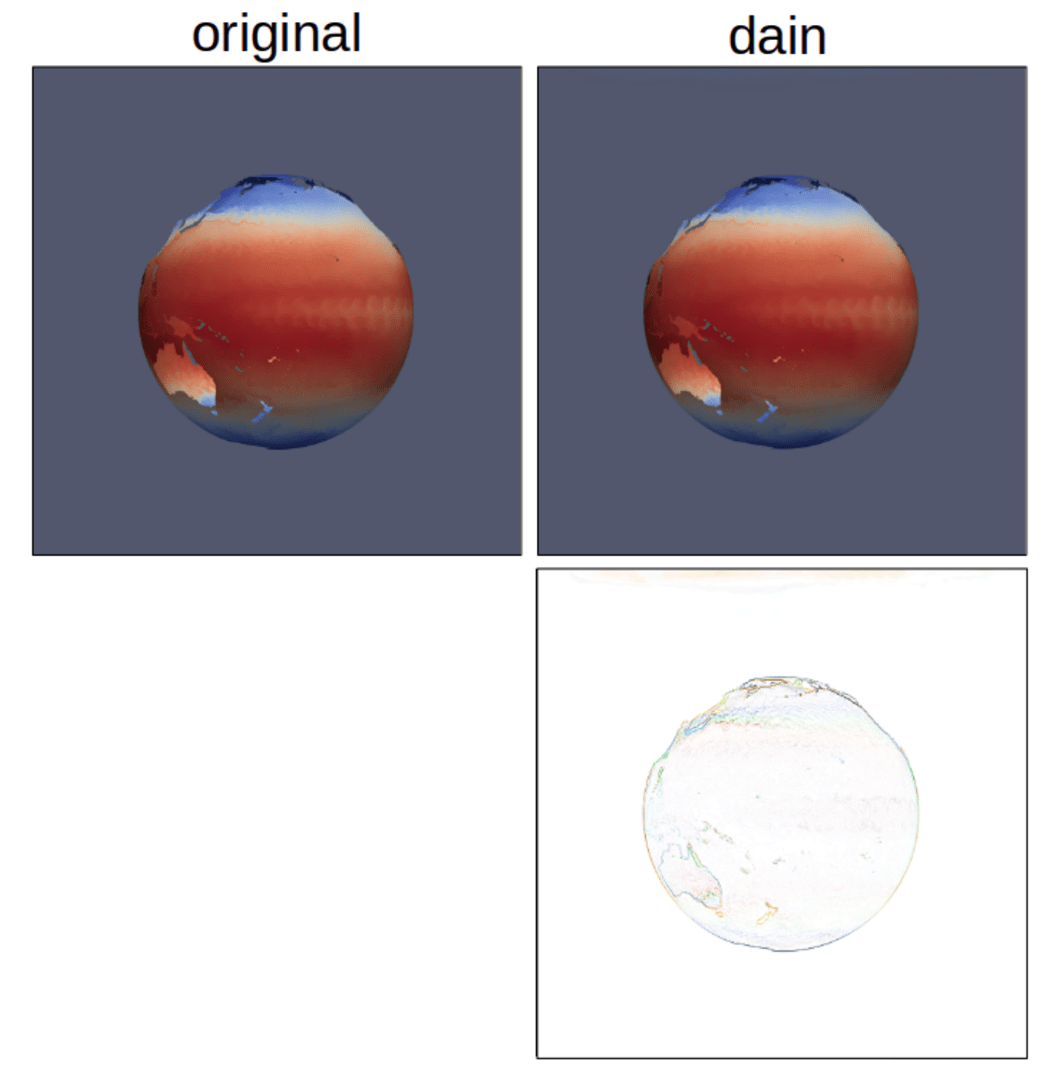
Figure 3. Difference between an interpolated frame and the original. MPAS dataset in “Interpolation of Scientific Image Databases.”
Cinema also supports other analysis, including inferring (or interpolating) new viewpoints and occluded regions from in-situ rendered images, use of parallel coordinates, as well as visualizing uncertainty and error estimates.[iii] The viewers section of the Cinema project homepage describes other visual analysis modes available with this software.
ALPINE for Algorithms and Infrastructure
The ECP ALPINE software infrastructure project, led by James Ahrens (LANL), enables users to computationally identify features of in-situ simulations and provides them with high-performance infrastructures for in-situ exascale visualization. The ALPINE team is addressing two problems related to exascale processing: (1) delivering infrastructure and (2) delivering high-performance in-situ algorithms.[iv]
Algorithm Development
ALPINE includes algorithms for topological analysis, adaptive data-driven sampling approaches, task-based feature detection, statistical feature detection, Lagrangian flow analysis, and optimal viewpoint characterization. These algorithms can be used in concert with Cinema to develop visualization pipelines to support scientific discovery. The ALPINE algorithms documentation describes these features, capabilities, and more.
Infrastructure and the Lightweight ALPINE/Ascent In-Situ Framework
ALPINE is delivering its capabilities through multiple in-situ infrastructures and post-processing applications. Well-known packages such as ParaView/Catalyst and VisIt are included.
As part of their ECP effort, ALPINE is also developing a very lightweight in-situ framework called Ascent. The Ascent team is focused on developing a streamlined API that occupies a minimal memory footprint and permits small binary size.
A Focus on Integration
The Cinema team is rewriting the library code to simplify the interface and make it easier to use based on feedback from ECP Software Technology projects and other ECP application use cases. This rewrite includes the integration of the algorithms and infrastructure to better support ECP needs. Target use cases are being vetted on current ECP test beds and on the actual exascale systems as they come online. For example, the team has already demonstrated particle-based feature detection in collaboration with the ECP MFIX-Exa project. In the integration pipeline, which was developed collaboratively by Cinema and ALPINE, ALPINE’s Catalyst infrastructure is used to run the statistical feature detection algorithm to identify void regions and write out a feature similarity field in situ. That similarity field can then be used in a post hoc workflow to identify the void as bubbles, and images are generated for each bubble (Figure 4).
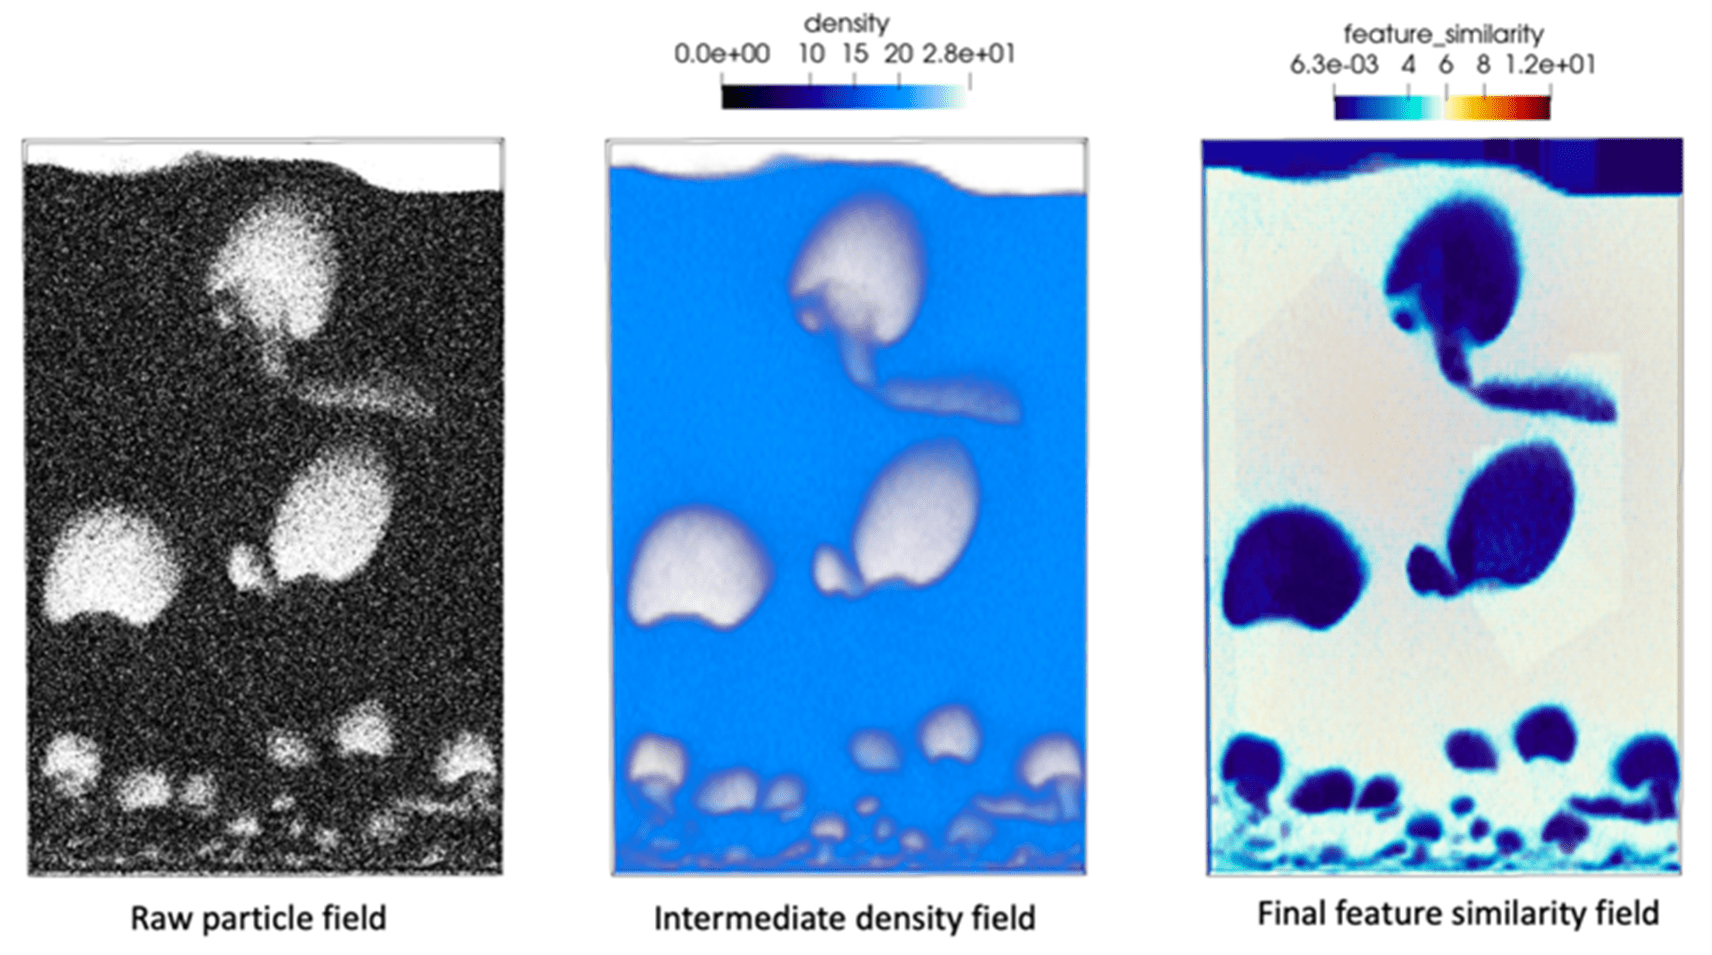
Figure 4. Feature detection of bubbles. ALPINE’s in-situ statistical feature detection algorithm is used to identify voids or bubbles in the data. The output is reduced from 5 × 10⁹ particles to a small scalar output field.
Rogers notes, “The infrastructure is designed so scientists can think about the data—specifically the images—and not about the infrastructure that accomplishes the task. Basically, give people the Python components that allow them to do their work. Don’t overdesign the tools.” Additional information can be found in “In Situ Feature Analysis for Large-Scale Multiphase Flow Simulations.”
The infrastructure is designed so scientists can think about the data—specifically the images—and not about the infrastructure that accomplishes the task. Basically, give people the Python components that allow them to do their work. Don’t overdesign the tools. – David Honegger Rogers
Explore Data in New Ways
Cinema’s use of metadata combined with the power of Python and Jupyter notebooks provide scientists with a host of new ways to explore their data.
Cinema has two viewers that scientists can use to explore complex datasets in novel ways. The Cinema:View viewer allows scientists to explore multiple simulation results through a set of sliders (based on the metadata).
The Cinema:Explorer viewer utilizes a parallel coordinate view to make it easy to interactively query an entire database of images (Figure 5). A parallel coordinates view (along the top of the application) maps each row in a data table as a line or profile.[v] Each gray line in the image below represents a sample ID (e.g., time_step, image_number). For visual purposes, a smoothed version of these gray lines then passes through the appropriate value of the remaining y-axis values. These are the thumbnail images below the parallel coordinates plot.
For example, Cinema can be used to explore bubble dynamics shown in Figure 6 in a fast, interactive workflow. In this case, the parallel coordinate plot reflects values of interest to the scientist, namely time_step, feature_id, aspect_ratio, volume, and x_center. The thumbnail images are selected by time_step.
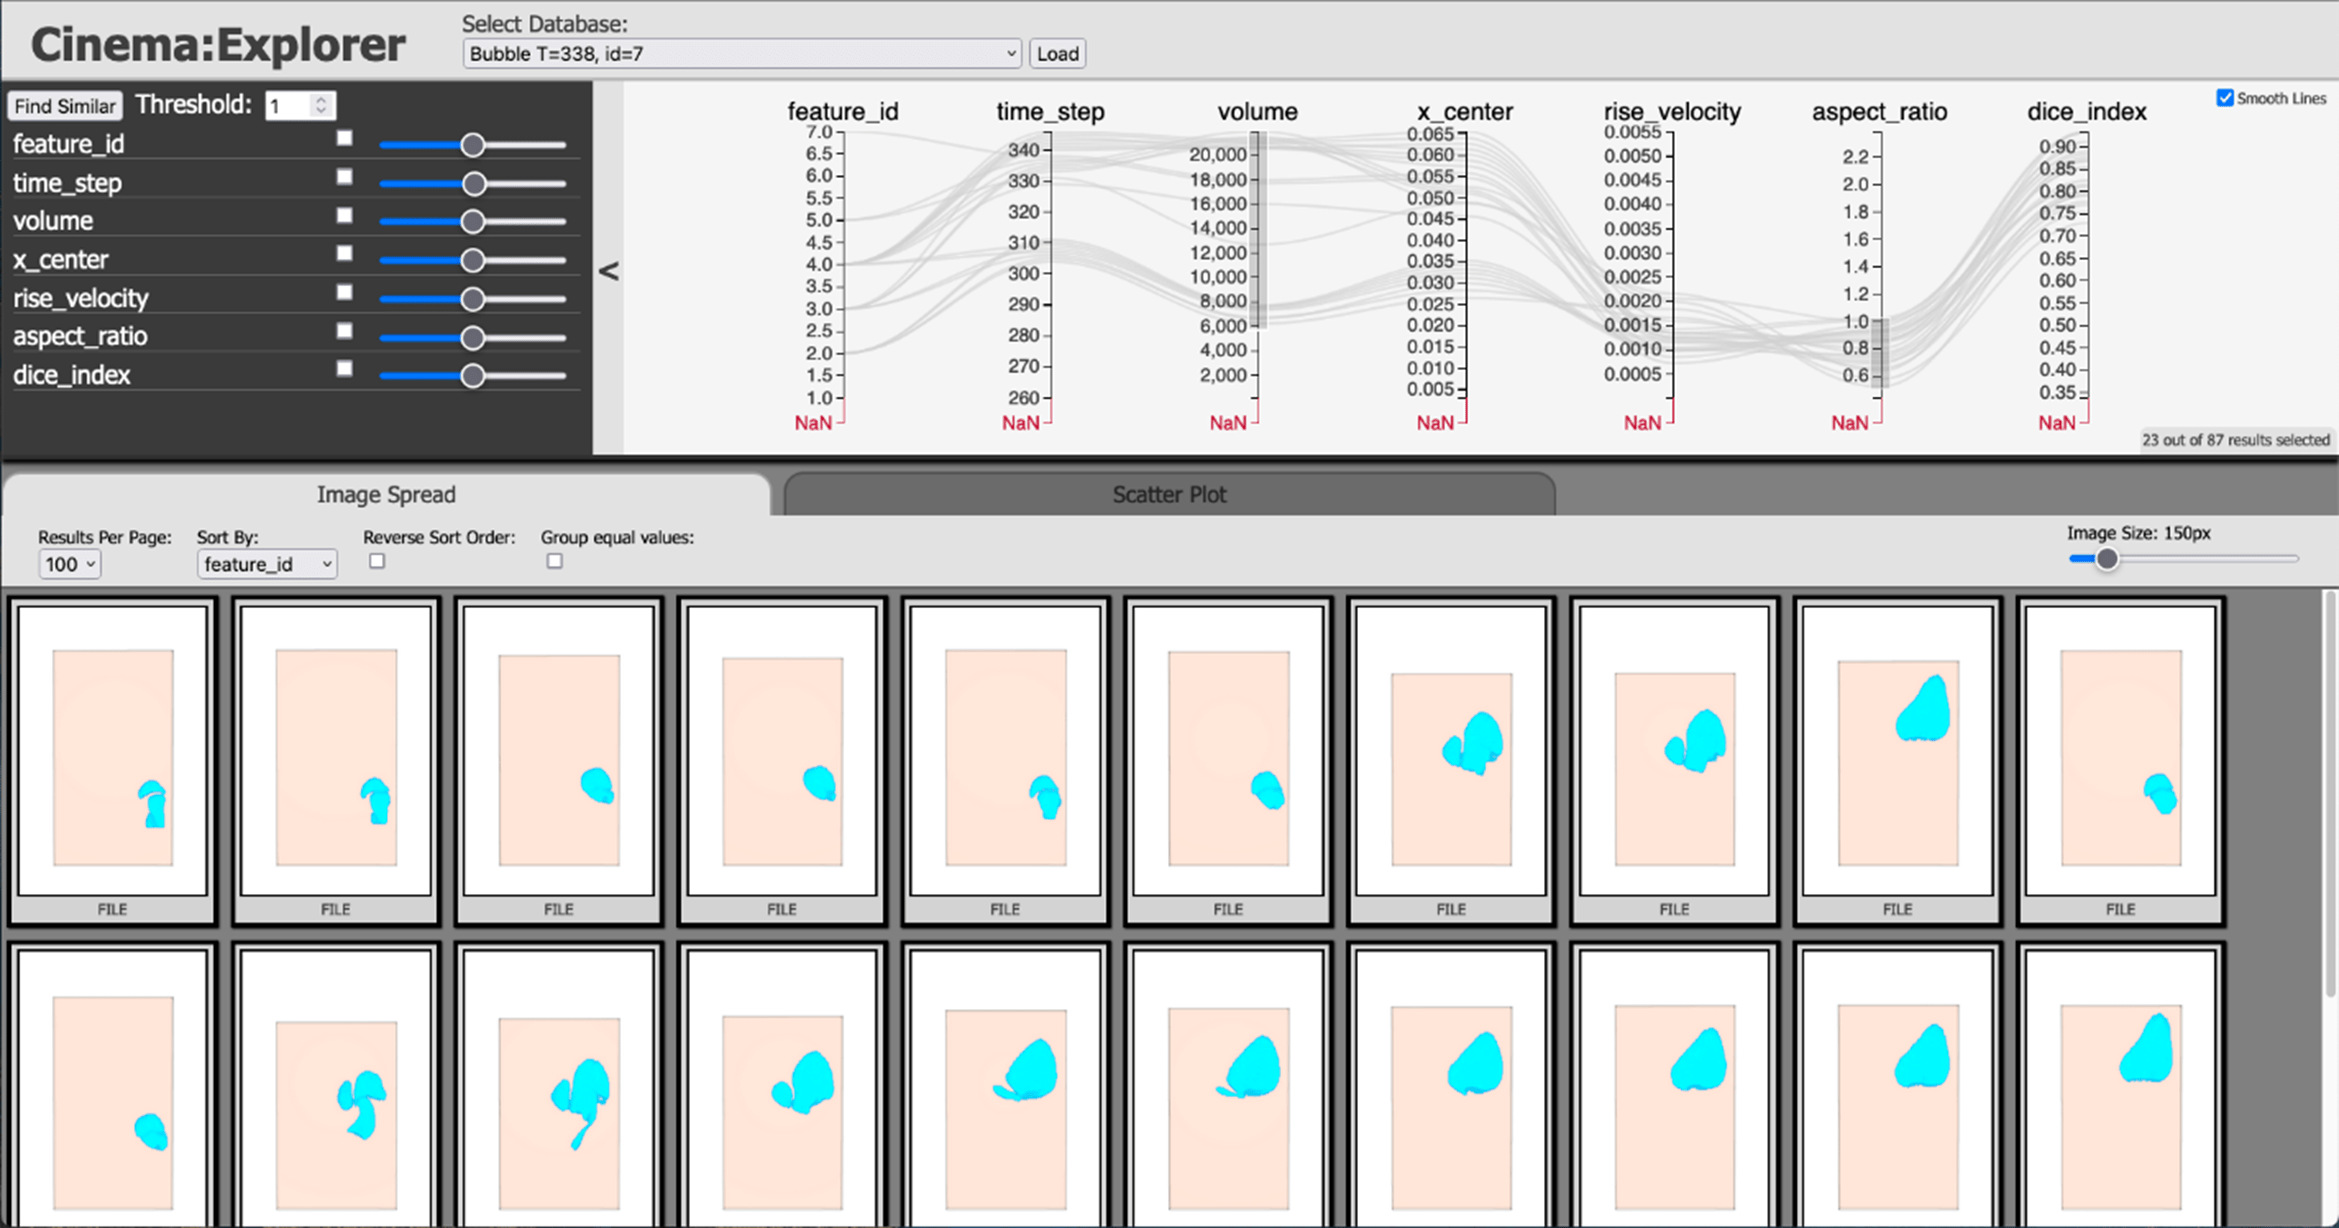
Figure 5. The output similarity field is used to generate a Cinema database of individual bubbles. The bubbles dynamics can be explored through Cinema:Explorer’s parallel coordinates.
Scientists can create additional informative plots, such as a scatter plot of the bubble life cycle as a function of time (Figure 6).
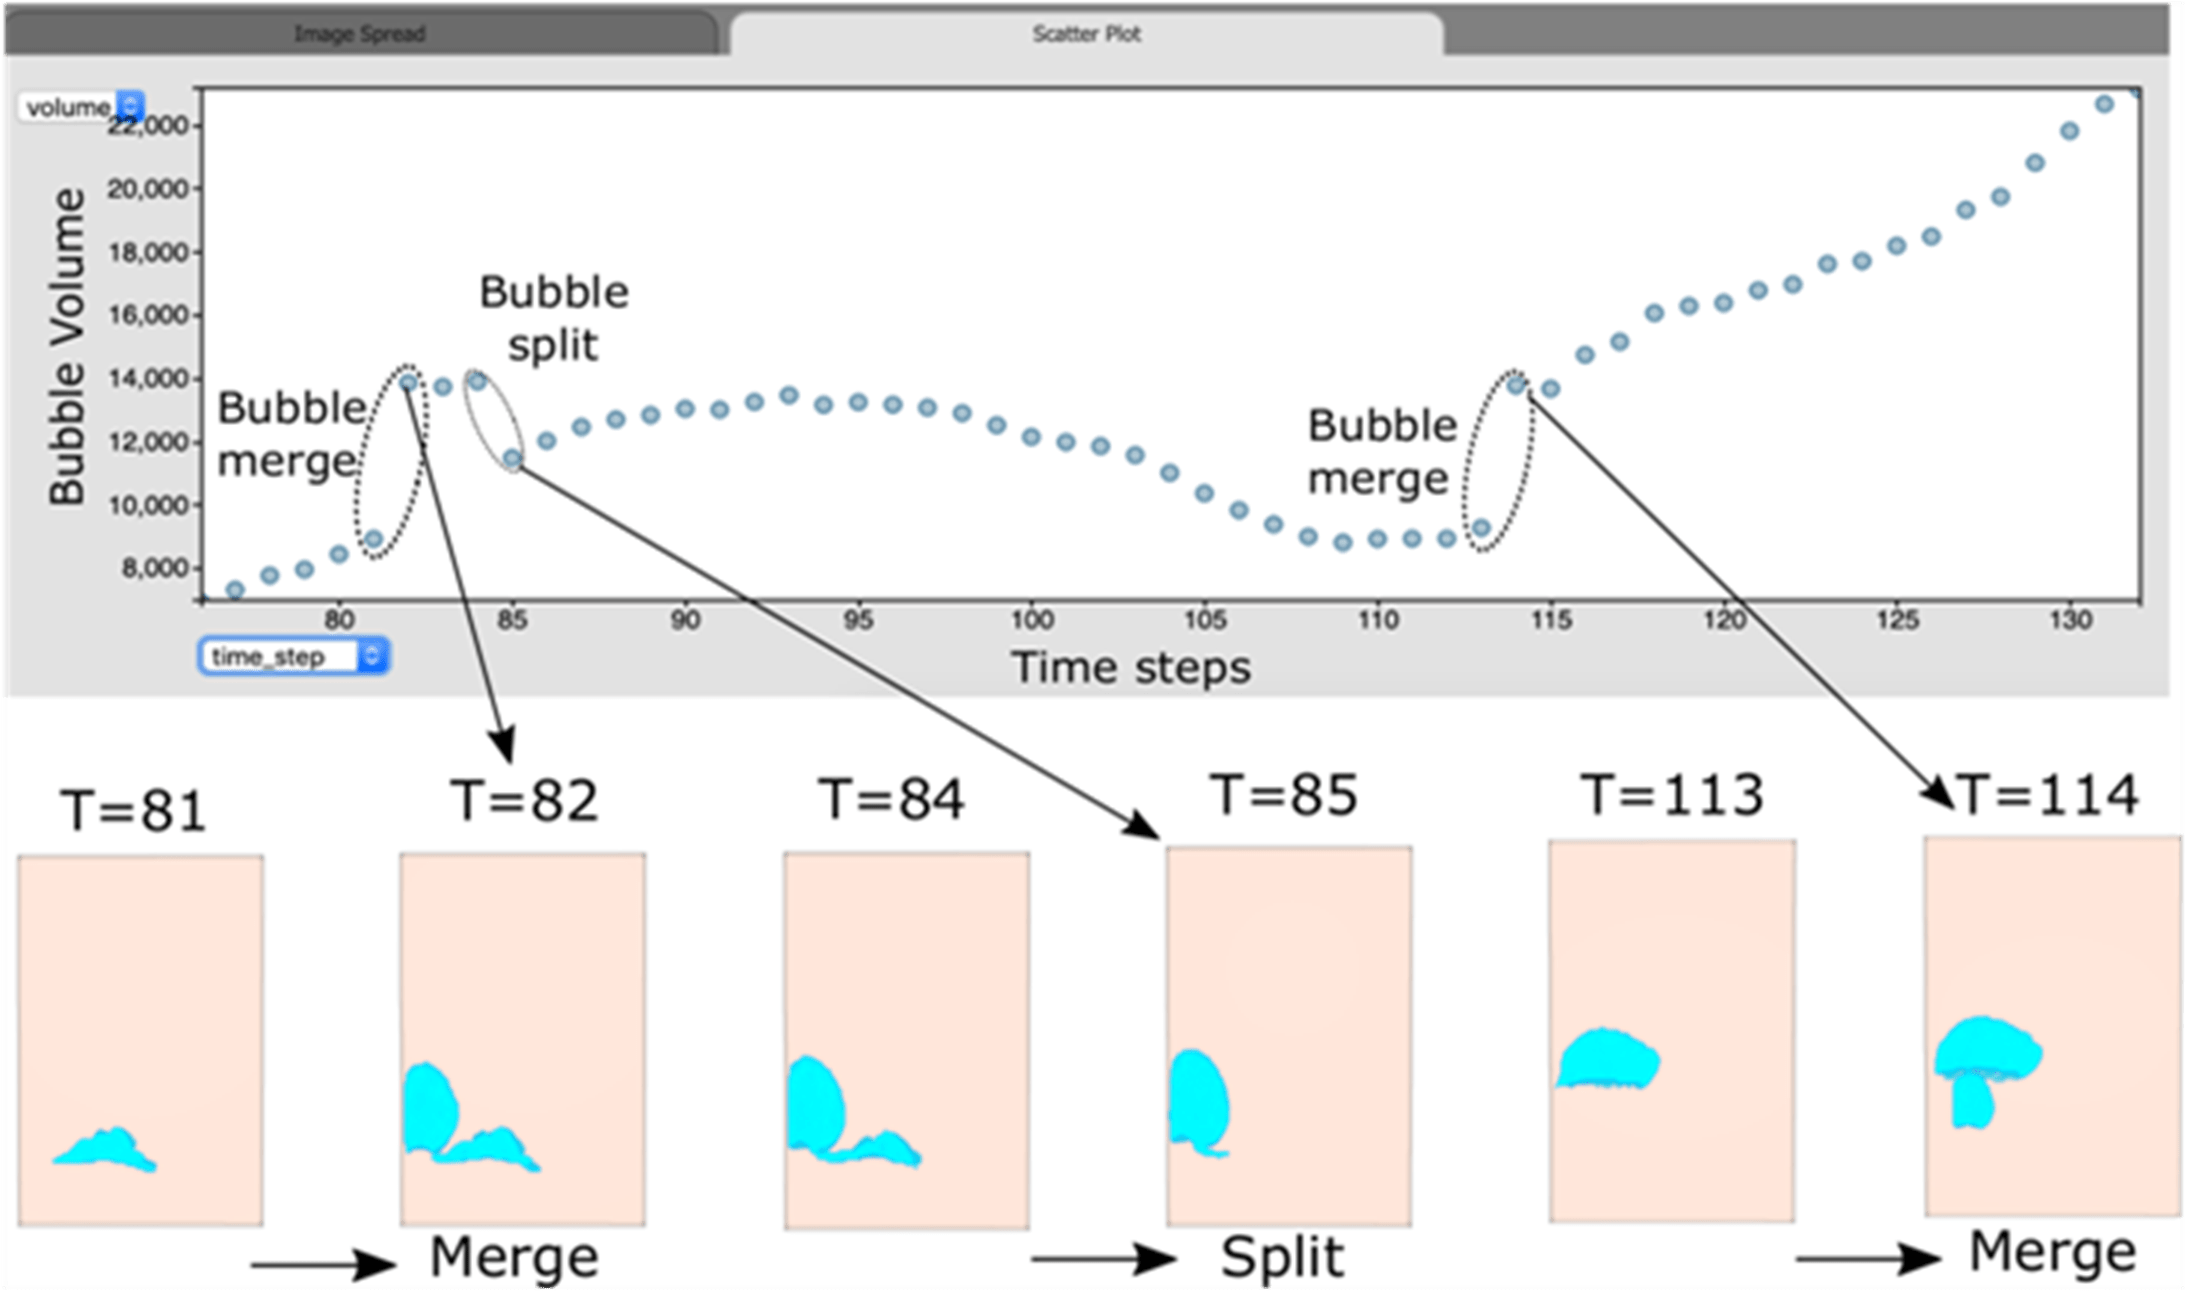
Figure 6. A bubble life cycle can be plotted as a function of time via the scatterplot view.
“The Cinema:Explorer viewer,” Rogers claims, “augments in-situ visualization because the researcher can interactively query and explore many aspects of their data.”
The Cinema:Explorer viewer augments in-situ visualization because the researcher can explore artifacts and other aspects of their data. – David Honegger Rogers
Summary
The Cinema visualization analytics effort has created a powerful, open-source software ecosystem that addresses the last-mile problem in scientific visualization—a problem in which modern systems generate datasets that are simply impractical to store. Leadership-class supercomputers will simply widen the gap between the amount of data that can be generated vs. the amount of data that can be stored. Addressing this problem requires in-situ visualization. The use of metadata, Python, and Jupyter notebooks provides scientists with tremendous flexibility in visualizing and analyzing their in-situ rendered data. The feedback from the ECP application development, software technology projects, and integration efforts provides critical lessons learned to keep the interface simple yet capable.
This research was supported by the Exascale Computing Project (17-SC-20-SC), a joint project of the U.S. Department of Energy’s Office of Science and National Nuclear Security Administration, responsible for delivering a capable exascale ecosystem, including software, applications, and hardware technology, to support the nation’s exascale computing imperative.
Rob Farber is a global technology consultant and author with an extensive background in HPC and in developing machine learning technology
[i] https://www.exascaleproject.org/supporting-scientific-discovery-and-data-analysis-in-the-exascale-era/
[ii] https://www.osti.gov/servlets/purl/1843572#page=67
[iii] https://cinemascience.github.io/viewers.html
[iv] https://ALPINE.dsscale.org/
[v] https://docs.tibco.com/pub/spotfire/6.5.2/doc/html/para/para_what_is_a_parallel_coordinate_plot.htm