By Rob Farber, contributing writer
The development of the VTK-m toolkit, a scientific visualization toolkit for emerging architectures, is a critical advancement in support of scientific visualization on exascale and GPU-accelerated systems for high-performance computing (HPC) users. VTK-m is needed because—counterintuitively—GPUs currently have software challenges when supporting large-scale scientific visualization tasks. For historical reasons, their massively multithreaded architecture, separate memory subsystems, and advent of new visualization workflows, such as in situ and in transit visualization, that bypass data movement for big-data simulations are currently problematic for scientific visualization.
Ken Moreland, a senior research scientist in the Oak Ridge National Laboratory (ORNL) Visualization Group, notes that, “VTK-m introduces a new way of thinking about core visualization algorithms that can make better use of emerging computer architectures, such as GPUs. Most scientific visualization workloads for the exascale computing project (ECP) will use the VTK-m toolkit when running on the forthcoming exascale supercomputers.” This is because current US exascale systems are designed to work in concert with GPU accelerators to deliver exascale levels of performance.
“VTK-m introduces a new way of thinking about core visualization algorithms that can make better use of emerging computer architectures, such as GPUs. Most scientific visualization workloads for the ECP will use the VTK-m toolkit when running on the forthcoming exascale supercomputers.” —
Ken Moreland, senior research scientist in the ORNL Visualization Group
The welcome addition of the VTK-m GPU capability means that the many packages that use the well-established, heavily utilized Visualization Toolkit (VTK) for 3D computer graphics, image processing, and scientific visualization are no longer limited to CPU-based systems. Promising both performance and portability, the VTK-m team brings multivendor GPU support for 3D scientific visualization to all GPU-based scientific users because of its open-source nature. [i]
An Open-Source Project, VTK-m Brings Large-Scale GPU Scientific Visualization to All HPC Users
Created in 1993, the CPU-based VTK software has been wildly successful, and because of its open-source license, it has been widely adopted by the scientific community. The well-known ParaView and VisIt visualization packages are based on the VTK software.
As shown in Figure 1, small core count CPUs were predominant during the first two decades of VTK development. The red line in Figure 1 illustrates the small number of cores per socket used by the supercomputers in the TOP500 list from the early 1990s until 2014, which meant that there was no real need to optimize VTK for multicore, multithreaded performance. Machine architectures have since changed. Now, most supercomputers in the TOP500 list are GPU accelerated. [ii] All the currently planned US exascale systems will be GPU accelerated.
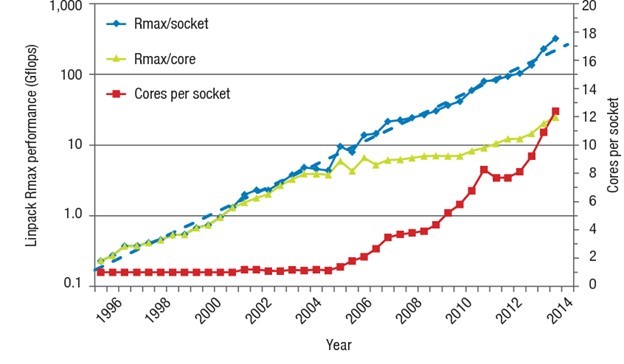
Figure 1. Cores per socket in the TOP500 systems until 2014. (Source: Strohmaier and Meuer, 2015.)
Modern systems based on many-core CPUs and massively parallel GPUs now support fine degrees of parallelism, which unfortunately adversely affects the performance of VTK on these devices. In addition to challenges with dynamic memory allocation, a paper by Moreland et al. (2016) justifies the need for VTK-m by observing that, “Finely threaded visualization algorithms need to be cognizant of potential load imbalance and schedule work accordingly.” The paper highlights that, “VTK-m implements visualizations using this new modality. This requires reimagining how we want to implement things. Clearly, we do not want to rewrite VTK. Instead, VTK-m has been designed to integrate with existing tools.”
“VTK-m implements visualizations using this new modality. This requires reimagining how we want to implement things. Clearly, we do not want to rewrite VTK. Instead, VTK-m has been designed to integrate with existing tools. Both ParaView and VisIt are adopting VTK-m functionality to support GPU-based processing.” — Ken Moreland
Key to VTK-m adoption is the portability it provides when moving to systems that provide this new fine-grained parallel—and with GPU acceleration—heterogeneous computing functionality. The idea is that developers can write their applications once by using VTK and have VTK-m support visualization on the latest highly parallel architectures. The VTK-m team even provides an interface to use the original VTK application programming interface (API), so VTK-m now provides a fundamental functionality for scientific visualization, as shown in Figure 1. Strong support by vendors means that users can run on GPU systems, regardless of which hardware vendor designed the hardware. Partly due to this portability aspect and strong vendor support, Moreland notes that, “Both ParaView and VisIt are adopting VTK-m functionality to support GPU-based processing.”
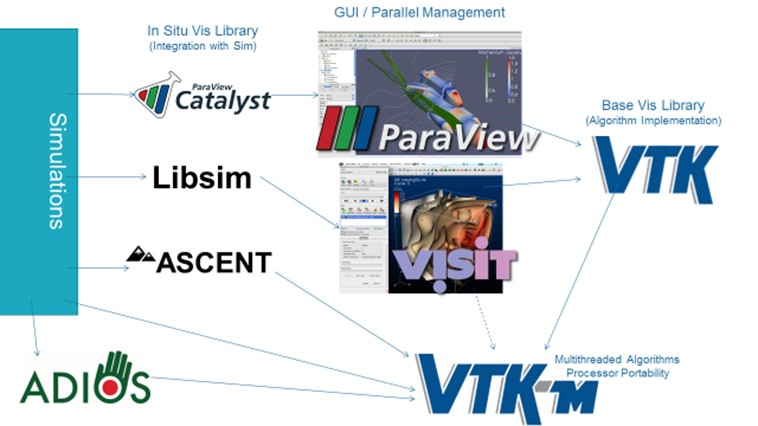
Figure 2. VTK-m provides basic functionality to deliver multithreaded performance portability.
Performance Realized
VTK-m team member Abhishek Yenpure (Figure 3), a PhD candidate at the University of Oregon—in collaboration with his advisor, Hank Childs, a professor in the Department of Computer and Information Science at the University of Oregon—performed a literature review to compare algorithm implementations.

Figure 3. PhD Candidate Abhishek Yenpure. (Source: Abhishek Yenpure.)
Figure 4 shows the ratio of the speedup or slowdown of the portable VTK-m algorithm performance relative to a nonportable implementation when run on the same hardware. An average 1.14 speedup was observed, which demonstrates that the portable performance of VTK-m is comparable to existing implementations. [iii]

Figure 4. Relative performance of the VTK-m GPU code compared with the CPU implementation of the same algorithm. For clarity, the Intel Xeon Phi results were removed. For full details, please see Moreland et al. (2021). (Data courtesy of Ken Moreland.)
A detailed discussion of the methodology and analysis of the experimental data is provided in Moreland et al. (2021), which is too lengthy to include here. Briefly, the results in Figure 4 are reported in terms of the geometric mean over the experiments performed where each column in the figure shows the following.
- Algorithm: Reports the name of the algorithm tested.
- CPUs column: VTK-m performance was compared with an algorithm written specifically for multicore CPUs and implemented using a parallel, multicore software framework (e.g., OpenMP). Performance was measured on the same multicore CPU.
- GPUs column: VTK-m performance was compared with an algorithm typically written in CUDA, and performance was measured on the same NVIDIA GPU.
- Serial column: VTK-m performance using one CPU core was compared with a serial-only algorithm. Again, performance was measured on the same CPU.
- Total: Reports the total speedup or slowdown. In Figure 4, Ken Moreland was kind enough to remove the Intel Xeon Phi results from this table for clarity because this hardware platform is no longer manufactured.
Compatibility Creates Opportunity
Compatibility with VTK means that VTK-m also provides a natural basis for the use of GPUs in new visualization techniques, such as in situ and in transit visualization. These techniques significantly reduce or eliminate data movement, which in turn can greatly speed visualization tasks and reduce power consumption in the datacenter.
For these reasons, in situ visualization was identified as a key technology to enable science at the exascale.[iv] An in situ visualization uses the same nodes to render the visualization as those used to perform the computation. Alternatively, an in-transit visualization relaxes the direct coupling of the visualization to the simulation. Instead, this technique gives users the ability to load-balance their workload by dedicating more nodes to computation instead of visualization. Unlike in situ, the in-transit visualization technique does incur some overhead when moving data across the communications fabric between nodes. Both methods keep the data in memory and avoid writing to storage.
Opportunity Drives Adoption
Moreland notes that many people in the ECP are working to integrate VTK-m as a component to support visualization on GPU-accelerated systems. Projects include the Alpine/ZFP ECP project for in situ infrastructure, data analysis, visualization, and compression for exascale science; the ParaView Catalyst (Catalyst) in situ use case library, which contains an adaptable API to orchestrate the work between simulation and analysis and/or visualization tasks; and libsim, the in situ library for VisIt.
The following are some ECP examples with other partners:
- Presentation – Large-Scale In Situ Visualization of Raleigh-Taylor Instability with Ascent and VTK-m
- Presentation – In_Situ_Visualization_in_WDMApp_Using_VTK-m
- Presentation – In Situ/In Transit Visualization with WarpX
Summary
Modern supercomputers leverage manycore processors and massively parallel GPU parallelism to achieve power efficiency, scalability, and soon-to-be-demonstrated exascale levels of performance. To keep pace with these developments, the VTK-m library has updated the memory management, load-balancing capability, and performance of numerous algorithms to support scientific visualization on these new architectures. Furthermore, VTK-m was designed to integrate with existing tools and has strong multivendor support, which makes it a core library that will be used by all ECP visualization workloads when running on the forthcoming US exascale supercomputers. Even better, VTK-m is freely available for all HPC users so they can leverage the performance of GPU accelerators for their scientific visualization workloads.
Rob Farber is a global technology consultant and author with an extensive background in HPC and machine learning technology development that he applies at national labs and commercial organizations. Rob can be reached at [email protected].
[i] K. Moreland et al., “VTK-m: Accelerating the Visualization Toolkit for Massively Threaded Architectures,” IEEE Computer Graphics and Applications 36, no. 3 (2016): 48–58. doi: 10.1109/MCG.2016.48.
[ii] Top 500. https://top500.org/. Accessed November 5, 2021.
[iii] K. Moreland et al., “Minimizing Development Costs for Efficient Many-Core Visualization Using MCD3,” Parallel Computing 108 (2021): 102834. doi: 10.1016/j.parco.2021.102834.
[iv] https://www.researchgate.net/publication/320532501_Report_from_the_DOE_ASCR_2011_Workshop_on_Exascale_Data_Management_Analysis_and_Visualization